Visualize the effect of varying a stacks parameter on the number of SNPs retained
vis_snps.RdThis function takes the list of dataframes output by optimize_m(), optimize_M(), or optimize_n() as input. The function then uses ggplot2 to visualize the effect of the given stacks on the number of SNPs retained.
vis_snps(output = NULL, stacks_param = NULL)
Arguments
| output | A list containing 5 dataframes generated by optimize_m() |
|---|---|
| stacks_param | A character string indicating the stacks parameter iterated over |
Value
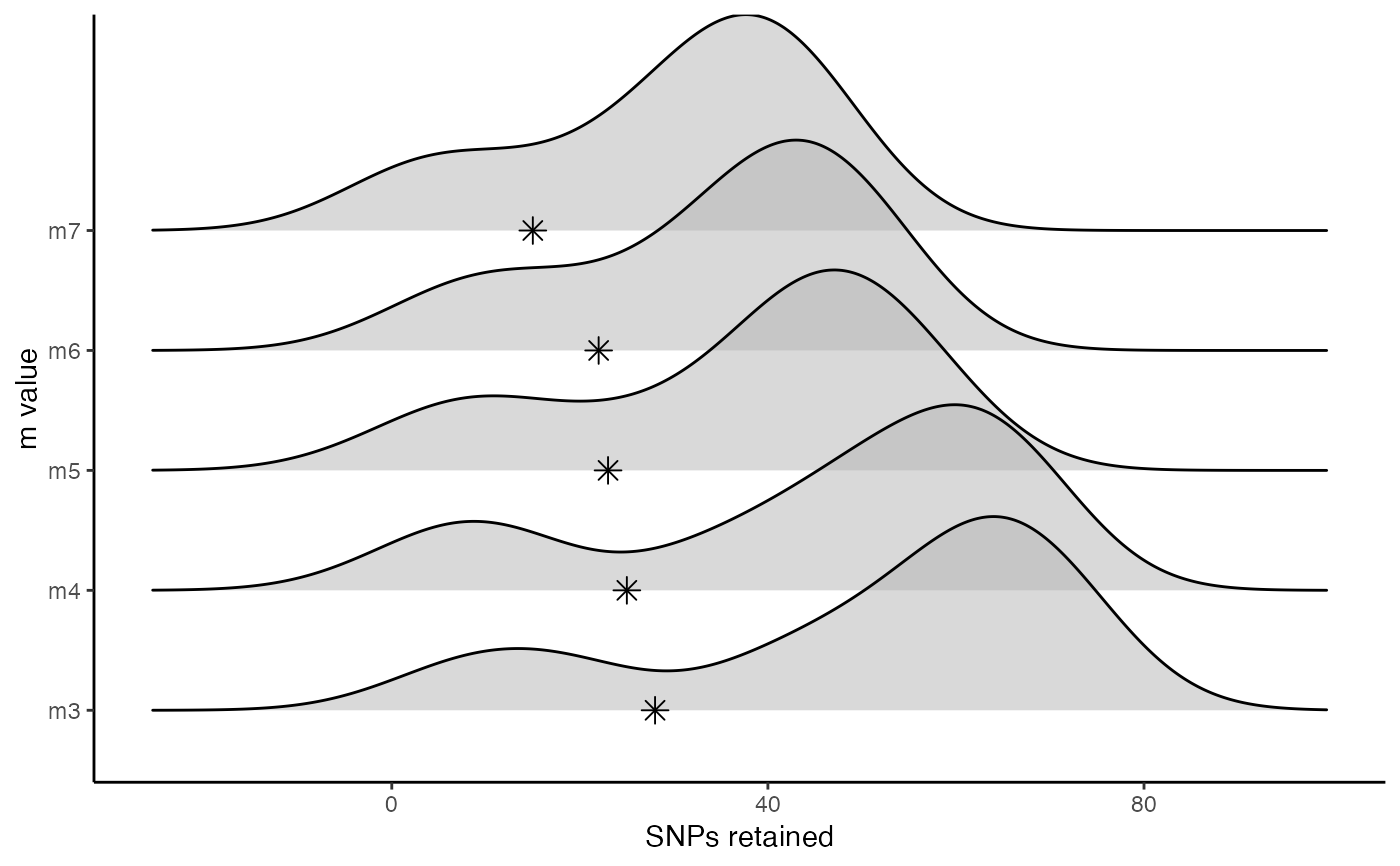
A plot showing the number of SNPs retained at each given parameter value
Examples
vis_snps(output= readRDS(system.file("extdata","optimize.m.output.RDS",package="RADstackshelpR",mustWork=TRUE)), stacks_param = "m")#> Visualize how different values of m affect number of SNPs retained. #> Density plot shows the distribution of the number of SNPs retained in each sample, #> while the asterisk denotes the total number of SNPs retained at an 80% completeness cutoff.#>