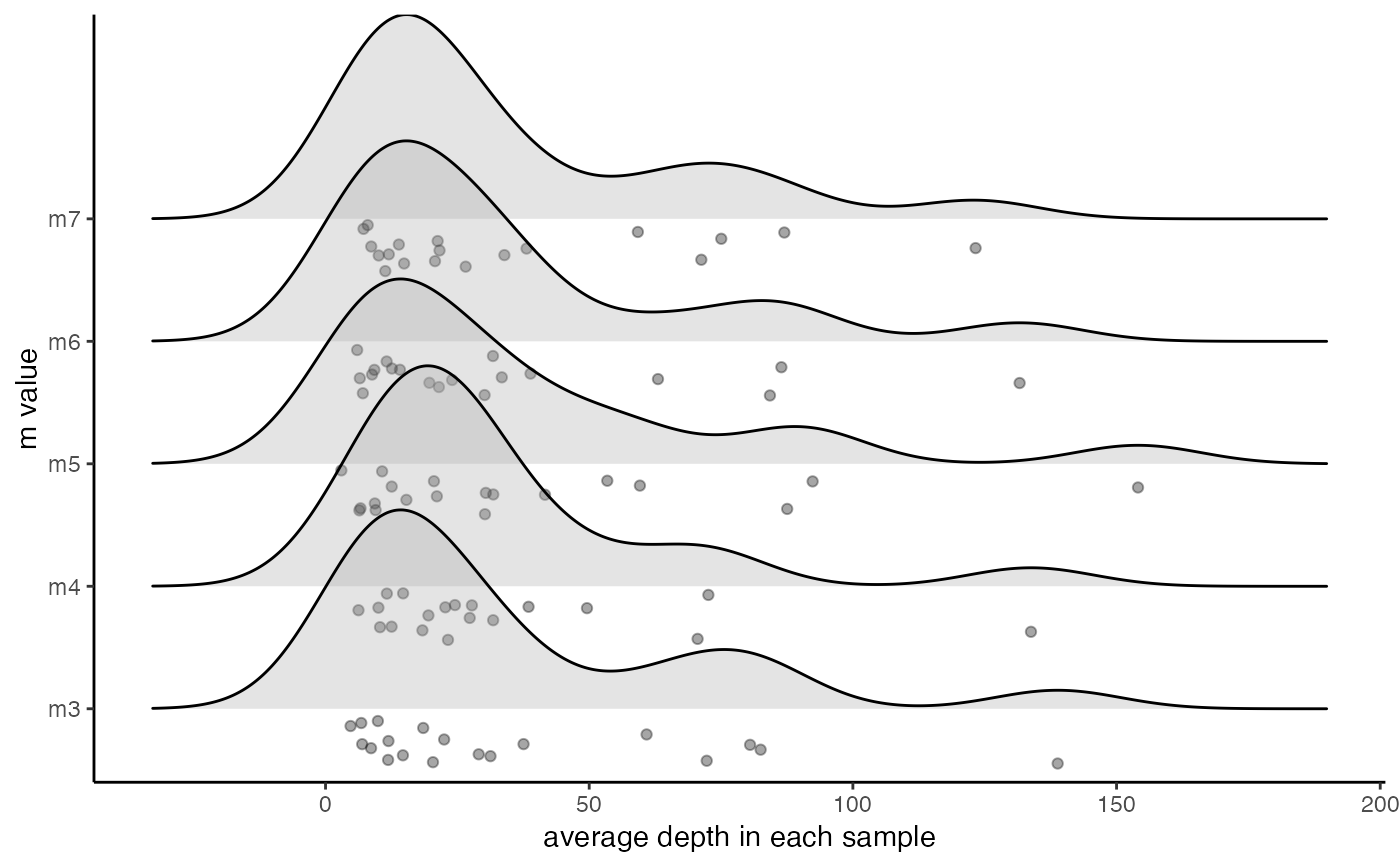
Visualize the effect of varying the m parameter on the mean depth of each sample
vis_depth.RdThis function takes the list of dataframes output by optimize_m() as input. The function then uses ggplot2 to visualize the effect of m on depth.
vis_depth(output = NULL)
Arguments
| output | A list containing 5 dataframes generated by optimize_m() |
|---|
Value
A plot showing the depth of each sample at each given m value
Examples
vis_depth(output = readRDS(system.file("extdata","optimize.m.output.RDS",package="RADstackshelpR",mustWork=TRUE)))#> [1] "Visualize how different values of m affect average depth in each sample"#>